
TL;DR:
- Trade logging transforms market experience into actionable insights, increasing accuracy and consistency.
- Effective logs should include key metrics like entry, exit, risk, emotional state, and reasoning.
- Automated platforms help scale and analyze trades more efficiently, boosting trading performance.
Most traders believe skill is everything. But 70-90% of retail traders lose money consistently, and a major contributing factor is the absence of any structured record-keeping practice. Trade logging isn't a bureaucratic chore reserved for institutional desks. It's the single most reliable way to turn raw market experience into repeatable, profitable behavior. This guide breaks down what trade logging actually is, how to build one from scratch, which metrics matter most, and how to choose between manual and automated approaches. Whether you trade forex, indices, or crypto, the principles here apply directly to your workflow.
Table of Contents
- What is trade logging and why does it matter?
- Core components and how to build your trading log
- Manual vs. automated trade logging: Pros, cons, and workflows
- Key metrics and how to analyze trading performance
- A fresh perspective: What most traders and critics miss about trade logging
- Level up your trade logging with smarter tools
- Frequently asked questions
Key Takeaways
| Point | Details |
|---|---|
| Trade logging boosts results | Structured records help traders improve accuracy, consistency, and risk control. |
| Include essential fields | Capturing both numbers and notes is crucial for actionable analysis. |
| Choose efficient methods | Automated solutions can save time and support faster performance feedback. |
| Metrics drive improvement | Reviewing win rate, profit factor, and drawdowns guides targeted progress. |
| Insight must lead to action | Regular reviews and actionable steps turn records into real gains. |
What is trade logging and why does it matter?
At its core, trade logging is a structured record capturing both quantitative and qualitative trade data. That means you're not just writing down your entry and exit prices. You're also documenting why you took the trade, what you were thinking, and how you felt when price moved against you. This dual focus separates a real trade log from a simple spreadsheet of numbers.
The misconception most traders carry is that a log is just an accounting tool. It's not. Think of it as a feedback loop. Every trade you record becomes a data point that reveals patterns you'd never spot in real time. Over dozens of trades, those patterns tell you which setups actually work, which times of day drain your account, and whether your risk management is consistent or erratic.
Who benefits? Everyone, but differently. Individual traders use logs to build self-awareness and eliminate emotional mistakes. Professional traders and prop firm participants use them to demonstrate process discipline and identify statistical edges. The performance gains with trading journals are well-documented across both groups.
The numbers back this up. Traders who maintain journals consistently show 15-20% better accuracy, 40% fewer impulsive trades, and 73% higher consistency compared to those who don't log at all. That's not a marginal improvement. That's the difference between a trader who survives and one who compounds.
Here's what a complete trade log captures:
- Entry and exit prices with timestamps
- Position size and the reasoning behind it
- Setup or strategy type used for the trade
- Emotional state before, during, and after
- Outcome including P&L and R-multiple
- Post-trade notes on what you'd do differently
"A trade log without qualitative notes is just an expense report. The real value lives in the reasoning, not the result."
This is the foundation. Once you accept that logging is about insight rather than record-keeping, the entire practice shifts from a burden to a competitive advantage.
Core components and how to build your trading log
Now that you know why trade logging matters, let's look at the nuts and bolts of constructing an effective log. The good news is you don't need to build something complex from day one. You need the right fields, not the most fields.
Core mechanics for a trading journal include date and time, instrument, direction (long or short), entry and exit prices, position size, stop-loss and take-profit levels, P&L, setup or strategy type, risk-reward ratio, notes, and screenshots. That's your complete framework.

Here's a quick reference table for building your log:
| Field | What it captures | Why it matters |
|---|---|---|
| Date and time | When the trade occurred | Reveals time-of-day patterns |
| Instrument | Asset traded | Tracks performance by market |
| Direction | Long or short | Identifies directional bias |
| Entry and exit | Price levels | Measures execution quality |
| Position size | Lot or contract size | Monitors risk consistency |
| Stop-loss and take-profit | Risk parameters | Validates risk management |
| P&L | Dollar or pip outcome | Tracks raw profitability |
| Strategy type | Setup label | Compares strategy performance |
| Risk-reward ratio | R-value | Evaluates trade quality |
| Notes and screenshots | Context and visuals | Enables pattern recognition |
Pro Tip: Start with just five fields: date, instrument, direction, P&L, and one note per trade. Build the habit first. Add complexity after 30 days of consistent logging.
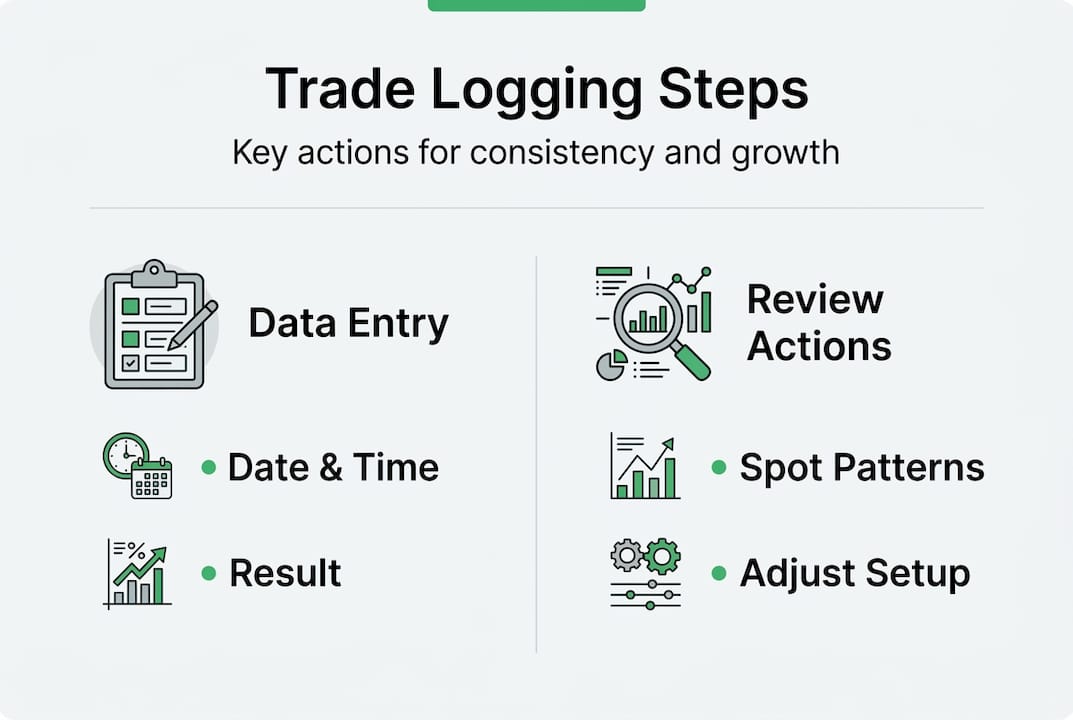
For beginners setting up their first log, here's a simple process to follow:
- Choose your format. A spreadsheet works fine to start. Trading journal templates can save you setup time.
- Create one row per trade with your chosen fields as column headers.
- Log every trade immediately after closing it, not at end of day.
- Add a brief note explaining your reasoning for entering the trade.
- Review your log at the end of each week and highlight one pattern, positive or negative.
Consistency beats complexity every time. A simple log you actually use beats a sophisticated one you abandon after two weeks.
Manual vs. automated trade logging: Pros, cons, and workflows
Once you understand how to build a log, choosing your methodology becomes the next logical step. There are three main approaches: manual entry, broker exports, and dedicated software with auto-import features.
Manual logs using spreadsheets or notebooks give you full control over what you track and how you organize it. Automated platforms pull data directly from your broker, calculate metrics instantly, and surface patterns without requiring manual input. Broker exports sit in the middle: you download a CSV and paste it into your log, which saves typing but still requires cleanup.
Here's how the three methods compare:
| Feature | Manual | Broker export | Dedicated software |
|---|---|---|---|
| Setup time | Low | Medium | Low |
| Data accuracy | User-dependent | High | High |
| Automation level | None | Partial | Full |
| Metric calculation | Manual | Partial | Automatic |
| Pattern detection | Manual | None | AI-assisted |
| Best for | Beginners | Intermediate | Active or pro traders |
Manual logging works well when you're starting out and trading low frequency. The act of typing each trade forces you to reflect, which builds awareness. The downside is that it doesn't scale. If you're placing 10 to 20 trades per day, manual entry becomes a bottleneck.
The AI trading journal advantages become clear at higher trade volumes. Automated platforms eliminate data entry errors, calculate your key metrics in real time, and often flag patterns you'd miss manually. They also support multi-account management, which is critical for traders running multiple strategies or prop firm accounts simultaneously.
When should you upgrade from manual to software? Consider these signals:
- You're logging more than 5 trades per day consistently
- You're spending more time entering data than reviewing it
- You want AI-driven pattern detection across hundreds of trades
- You're managing more than one account or strategy simultaneously
The right tool depends on where you are in your trading journey, not on what's most impressive.
Key metrics and how to analyze trading performance
After mastering the tools and workflows, analyzing what's in your trade log lets you make targeted improvements. Raw data means nothing without interpretation. These are the metrics that actually matter.
Key performance metrics every trader should track include win rate, profit factor, expectancy, average R-multiple, and maximum drawdown. Here's what each one tells you:
- Win rate (target above 40%): The percentage of trades that close profitably. A high win rate with poor risk-reward still loses money.
- Profit factor (target above 1.5): Total gross profit divided by total gross loss. Anything above 1.0 means you're net positive.
- Expectancy: The average dollar amount you expect to make per trade. Positive expectancy is the foundation of a viable strategy.
- Average R-multiple: How much you make or lose relative to your initial risk per trade. Consistent positive R-multiples signal a real edge.
- Max drawdown (keep below 20%): The largest peak-to-trough loss in your account. High drawdowns signal either poor risk management or strategy failure.
Pro Tip: Review your log after every trade for quick notes, weekly for pattern spotting, and monthly for strategic decisions. This cadence keeps your analysis current without overwhelming you.
Traders who journal consistently see faster monthly gains and reduced drawdowns over time. The review cadence matters because patterns only become visible when you look at aggregated data, not individual trades.
The most actionable improvement process is simple: identify your two worst-performing setup types each month, reduce position size on those setups by 50%, and redirect that risk to your top two performers. Let the data drive the allocation, not your gut.
A fresh perspective: What most traders and critics miss about trade logging
Here's the uncomfortable truth. Most traders who try journaling quit within 30 days. Not because logging is hard, but because they log without acting. They collect data like it's a trophy, then wonder why nothing changes.
Abandonment is common when logs are too manual or when traders fail to take action on the patterns they find. The critics who dismiss trade logging often had this exact experience. They logged for a month, saw some patterns, felt good about the insight, and then kept trading the same way. That's not a failure of logging. That's a failure of application.
The real power of a trade log isn't the data. It's the decisions the data forces you to make. When your log shows that 80% of your losses happen in the first hour of the London session, you have two choices: stop trading that window, or accept that you're choosing to lose money. The log doesn't improve your trading. You improve your trading because the log makes denial impossible.
We've seen traders with case studies in trade logging who transformed their performance not by finding new strategies, but by eliminating the two or three recurring mistakes their log exposed. That's the real edge. Less noise, more signal.
Level up your trade logging with smarter tools
All the principles above are only as powerful as the system you use to apply them. If your logging workflow is slow, inconsistent, or buried in spreadsheet tabs, you'll eventually stop using it.
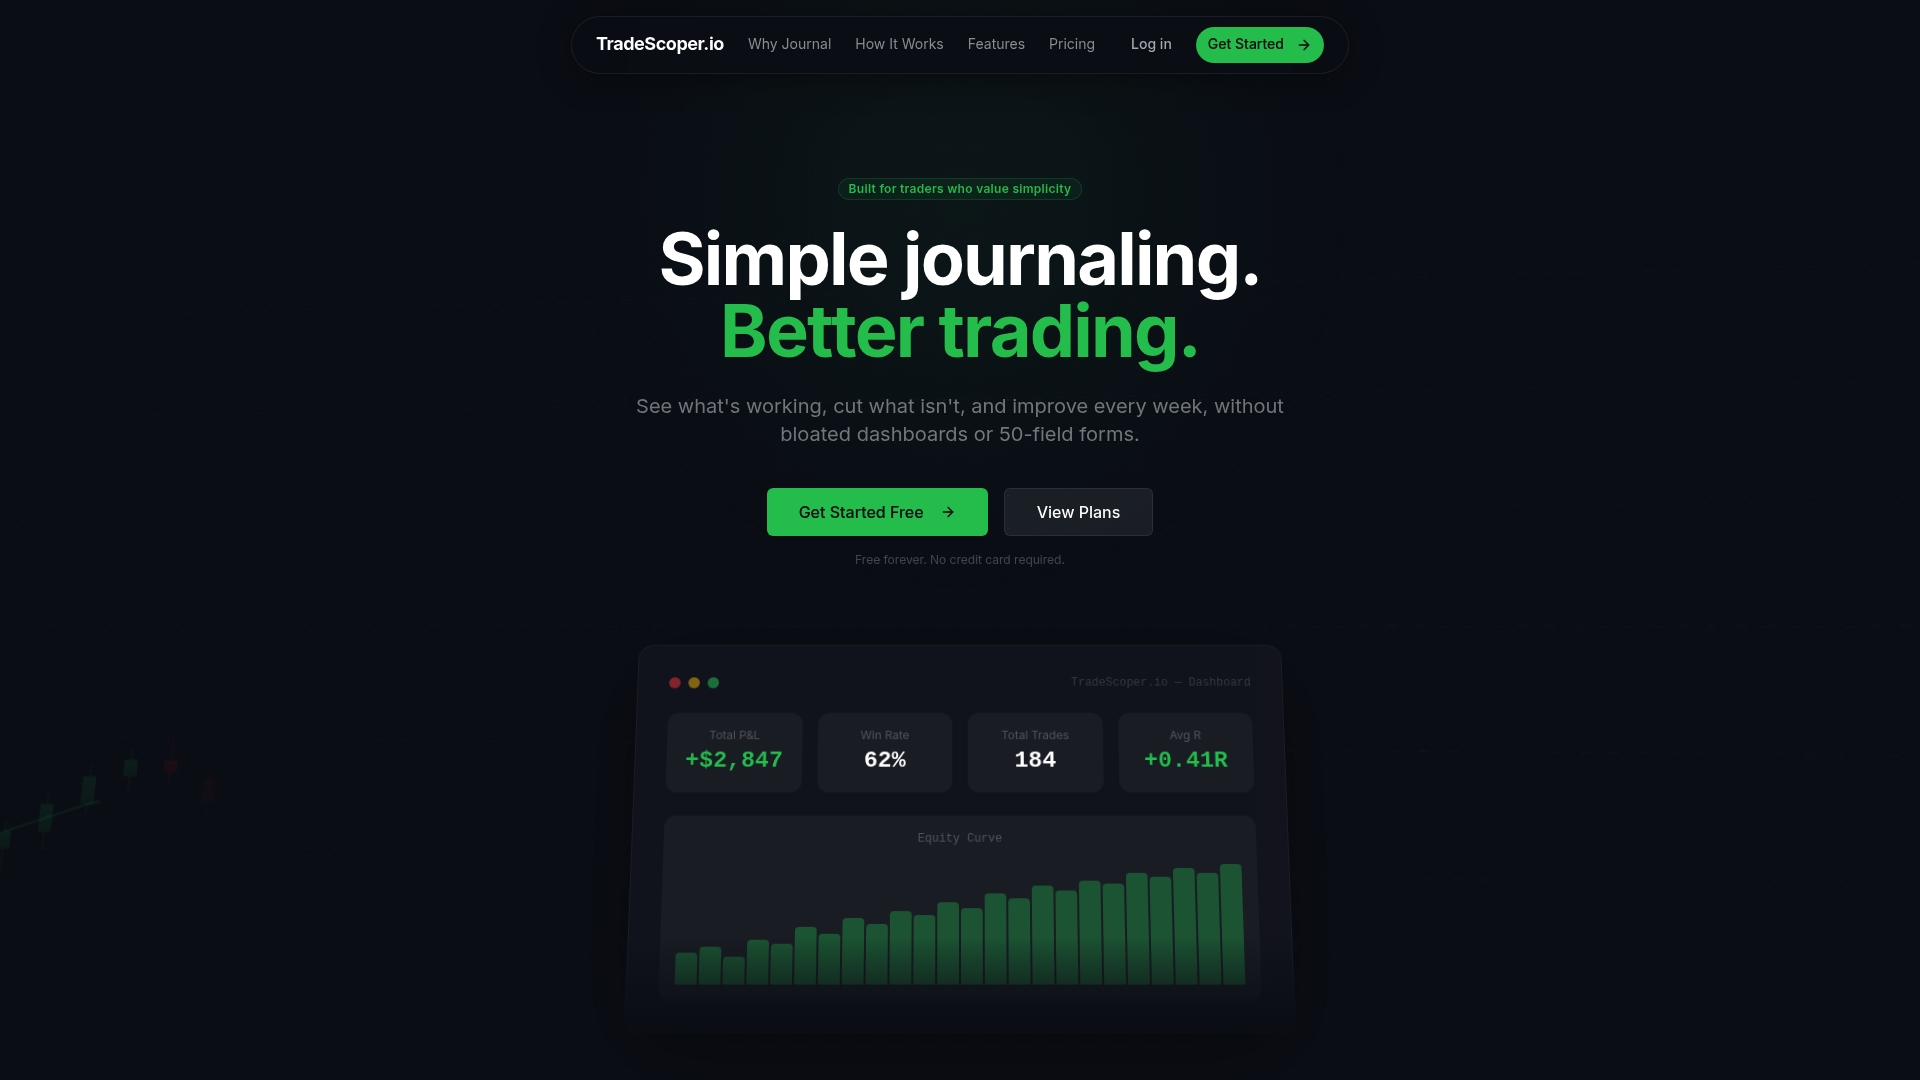
TradeScoper.io is built specifically for traders who want the benefits of rigorous trade logging without the friction of manual data entry. The platform connects to your broker, pulls your trades automatically, and surfaces the metrics that matter through a clean, minimalistic dashboard. The AI-powered trading journal identifies behavioral patterns, flags emotional trading tendencies, and helps you build consistency across sessions. Whether you're a beginner building your first log or a prop trader managing multiple accounts, TradeScoper.io scales with your needs. There's a free tier to get started, no credit card required.
Frequently asked questions
What are the must-have fields in a trading log?
Essential fields include date and time, instrument, direction, entry and exit prices, position size, stop-loss and take-profit levels, strategy type, and notes. These core fields give you enough data to identify patterns and measure performance accurately.
How much does trade logging improve trading consistency?
Traders who maintain journals consistently show 15-40% performance improvement and up to 73% higher consistency compared to those who don't log. The improvement compounds over time as you eliminate recurring mistakes.
Can I automate trade logging or do I need to log manually?
Both approaches work depending on your trade frequency and goals. Manual vs. software-based logging each has trade-offs: manual builds reflection habits, while dedicated software automates data entry and delivers real-time analytics at scale.
How often should I review my trade log?
The most effective review cadence is after each trade for quick notes, weekly for pattern analysis, and monthly for strategic refinement. Consistent review at all three intervals turns raw data into actionable decisions.