TL;DR:
- Trader development relies on systematic process tracking and analytics rather than chasing new signals.
- Core metrics like expectancy, profit factor, and win rate are essential for measuring and improving trading performance.
- Using automation tools for trade logging, review, and edge monitoring enhances consistency and adaptability across different trading styles.
Many traders spend months hunting for the perfect setup, convinced that one more indicator or strategy tweak will finally unlock consistent profits. The reality is more grounding: process tracking and analytics drive performance gains far more reliably than chasing new signals. Trader development is a systematic discipline, not a lucky discovery. This guide breaks down what real development looks like, which metrics matter most, and how day traders and swing traders can build review habits that actually stick. If you have ever felt stuck despite trying everything, the answer is probably in your process, not your setups.
Table of Contents
- What is trader development (and why most traders ignore it)
- Core metrics and the 10-step journaling methodology
- Adaptations for day and swing traders: What works, what doesn't
- Advanced: Monitoring edge decay, avoiding overfitting, and adapting through regime shifts
- Why focusing on process, not just outcomes, is the elite trader's secret weapon
- Take the guesswork out of trader development with smarter tools
- Frequently asked questions
Key Takeaways
| Point | Details |
|---|---|
| Track core metrics | Expectancy, profit factor, and win rate provide the clearest signals of real performance improvement. |
| Adopt structured journaling | A 10-step journaling routine with tagging, note-taking, and regular reviews leads to consistent growth. |
| Tailor habits to your trading style | Day and swing traders must adapt review frequency and focus metrics for top results. |
| Watch for edge decay | Monitor for rolling drops in your stats and adjust when your process loses effectiveness. |
| Keep it simple | Data proves that straightforward, well-tracked strategies usually beat complex systems over time. |
What is trader development (and why most traders ignore it)
Trader development is the ongoing, systematic improvement of your process, mindset, and method. It is not about finding a new indicator or copying someone else's playbook. It is about building a feedback loop that turns every trade, win or loss, into usable data.
Most traders sidestep this because it feels slow. They want results now, so they jump between strategies, tweak entries, and blame the market when things go wrong. But the traders who build lasting careers obsess over the mechanics underneath their results.
Here is what real development focuses on:
- Expectancy: Your average outcome per trade, accounting for win rate and reward-to-risk ratio
- Profit factor: Gross profits divided by gross losses, a clean measure of edge quality
- Win rate: The percentage of trades that close profitably
- Drawdown: The peak-to-trough decline in your account, measuring risk exposure
- R-multiple: How much you made or lost relative to your initial risk per trade
Core metrics like expectancy, profit factor, and win rate are central to real trader development, not just performance summaries. They tell you whether your process is sound, not just whether you got lucky last week.
"Most traders lose not because their edge is weak, but because they never measure it consistently enough to know."
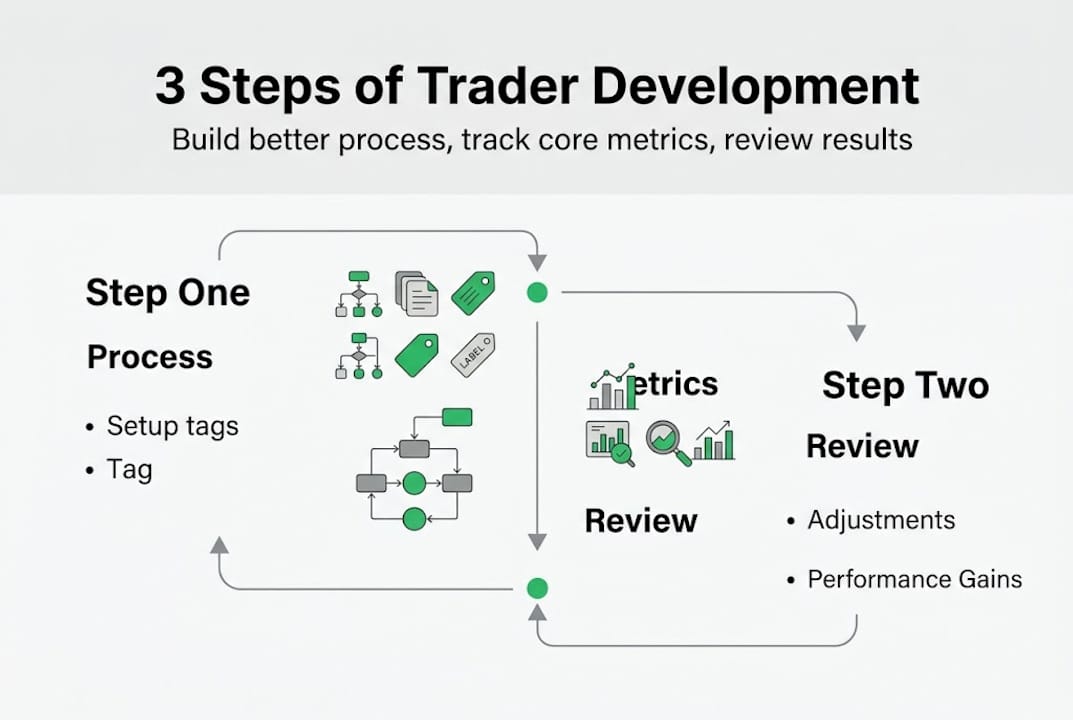
The foundational mechanics are simple: import your trades automatically, tag each setup, log your emotional state, and note your mistakes. These habits, tracked through the right trading tools for development, create the raw material for genuine improvement. And why trade logging matters becomes obvious fast once you see patterns you could never spot in real time.
Core metrics and the 10-step journaling methodology
Knowing which metrics to track is only half the job. You also need a repeatable process for capturing, reviewing, and acting on that data. Here is a 10-step journaling framework that elite traders actually use:
- Import trades automatically using broker integrations or CSV uploads
- Tag each trade by setup type, session, and market condition
- Log your emotional state before and after entry
- Record your rationale in a short note, one or two sentences is enough
- Mark mistakes separately from losses, not every loss is a mistake
- Calculate R-multiples for every closed trade
- Run a daily stat check on win rate, average R, and profit factor
- Conduct a weekly review to spot recurring errors and setup performance
- Compare setups to find which ones carry your edge and which drag it down
- Adjust position sizing based on current drawdown and rolling expectancy
10-step journaling with advanced stats meaningfully uplifts performance, and you need at least 100 trades before any backtest result carries statistical weight. Jumping to conclusions on 20 trades is one of the most common and costly mistakes in development.
Here is a quick reference for the metrics that matter most:
| Metric | Formula | Target value |
|---|---|---|
| Expectancy | (Win rate x Avg win) minus (Loss rate x Avg loss) | Greater than 0 |
| Profit factor | Gross profit divided by gross loss | Greater than 1.5 |
| Win rate | Wins divided by total trades | 40% or higher at 2:1 R |
| Max drawdown | Peak minus trough divided by peak | Below 20% |
| R-multiple | Trade P&L divided by initial risk | Positive average |
Expectancy above 0, profit factor above 1.5, and win rate above 40% at a 2:1 risk-to-reward ratio are empirical benchmarks used by serious traders. These are not arbitrary targets. They reflect what is needed for a process to survive real market variance.
Pro Tip: Block 15 minutes every Friday to do your weekly review before the weekend. Traders who skip this step consistently underperform those who treat it as non-negotiable. Pair it with logging trades efficiently to cut the time investment in half.
Common pitfalls include skipping emotional notes, not tagging setups consistently, and over-optimizing based on small samples. The AI-powered journaling tools available today can flag these gaps automatically, making the process faster and more reliable. The trade logging benefits compound quickly once the habit is locked in.
Adaptations for day and swing traders: What works, what doesn't
Trader development is not one-size-fits-all. Day traders and swing traders face different pressures, different data rhythms, and different psychological traps. Your review process needs to match your timeframe.

For day traders, the most valuable analytics center on time-of-day performance and initial balance (IB) breakouts. Time-of-day and IB breakout analysis reveal when your edge is strongest and when you are essentially gambling. Many day traders bleed profits in the final hour simply because they never checked their stats by session segment.
For swing traders, holding period analysis is the critical variable. Research points to an optimal holding window of 6 to 15 days for many swing strategies. The most common error is cutting winners early, which crushes profit factor even when the win rate looks healthy.
| Factor | Day traders | Swing traders |
|---|---|---|
| Key metric focus | Time-of-day P&L, IB breakouts | Holding period, avg winner duration |
| Review frequency | Daily plus weekly | Weekly plus monthly |
| Biggest pitfall | Overtrading after a loss | Cutting winners too early |
| Emotional trigger | FOMO during fast moves | Impatience during drawdown |
| Logging priority | Session tags, trade duration | Setup context, market regime |
Review frequency differs meaningfully between day and swing traders, and tailoring that cadence to your style is not optional. It is where development actually happens.
Key pitfalls by style:
- Day traders: Overtrading post-loss, ignoring session-level data, not tracking slippage
- Swing traders: Exiting before targets, adding to losers, skipping regime context in notes
Pro Tip: If you are a day trader, filter your journal by time of day and look at your P&L curve by hour. Most traders find one or two sessions where they consistently give back gains. Cut those sessions and watch your numbers improve immediately. Tracking trades for consistency makes this kind of analysis fast and actionable. Also review your efficient logging steps to make sure you are capturing the right data points from the start.
Advanced: Monitoring edge decay, avoiding overfitting, and adapting through regime shifts
Even a well-tested strategy will eventually stop working. Markets evolve. Volatility regimes shift. What printed profits in one environment can quietly erode your account in another. This is called edge decay, and ignoring it is one of the most expensive mistakes experienced traders make.
Here is a practical monitoring sequence to stay ahead of it:
- Track rolling expectancy over your last 20 to 50 trades, not just your all-time stats
- Run Monte Carlo simulations to stress-test your strategy against worst-case sequences
- Flag when profit factor drops below 1.5 as an early warning sign, not a post-mortem
- Separate execution errors from strategy failures before making any changes
- Test new adjustments out-of-sample before applying them to live trading
Edge decay is real; rolling expectancy monitoring and Monte Carlo analysis are the most reliable early-warning tools available. Waiting until your drawdown is severe before investigating is far too late.
"A strategy that worked last year may be structurally broken today. The market does not owe you consistency just because your backtest looked clean."
Overfitting is the silent killer of backtested strategies. 100,000-plus backtests show that simple strategies consistently outperform complex ones in live conditions. Every extra rule you add to a strategy increases the risk that you are fitting noise rather than capturing a real edge.
Execution drift is equally dangerous. This happens when your live trading gradually deviates from your tested rules, often due to emotional pressure or fatigue. The fix is automated trading analysis that compares your actual entries and exits against your planned rules, flagging drift before it becomes a habit. Pair that with consistency through trade logging and you have a self-correcting system.
Pro Tip: Set a monthly calendar reminder to review your rolling 30-trade expectancy. If it has dropped more than 20% from your baseline, treat it as a red flag and pause to investigate before adding size or frequency.
Why focusing on process, not just outcomes, is the elite trader's secret weapon
Here is the uncomfortable truth most trading content skips: outcomes are mostly noise in the short run. A bad trade can be profitable. A great trade can lose money. Judging your development by recent results is like judging a surgeon by whether the last patient survived, without asking whether the procedure was performed correctly.
Elite traders obsess over how they execute, review, and adapt, not just what signals they follow. They know that a losing month with disciplined process is more valuable than a winning month built on luck. The process is what compounds.
The contrarian insight here is that less is often more. Simpler strategies, rigorously reviewed, outperform complex systems that are rarely examined. Traders who constantly chase new edges rarely build the sample size needed to know if any edge actually works. Consistency of review beats novelty of strategy every time.
The best traders we have seen use trader development insights not to validate what they already believe, but to challenge it. They are willing to retire a setup that no longer fits the current regime, even if it was their best performer last year. That kind of adaptability only comes from trusting your process data more than your gut.
Take the guesswork out of trader development with smarter tools
Everything covered in this guide, from metric tracking to weekly reviews to edge decay monitoring, requires consistent data capture. Doing that manually is slow, error-prone, and frankly unsustainable alongside active trading.
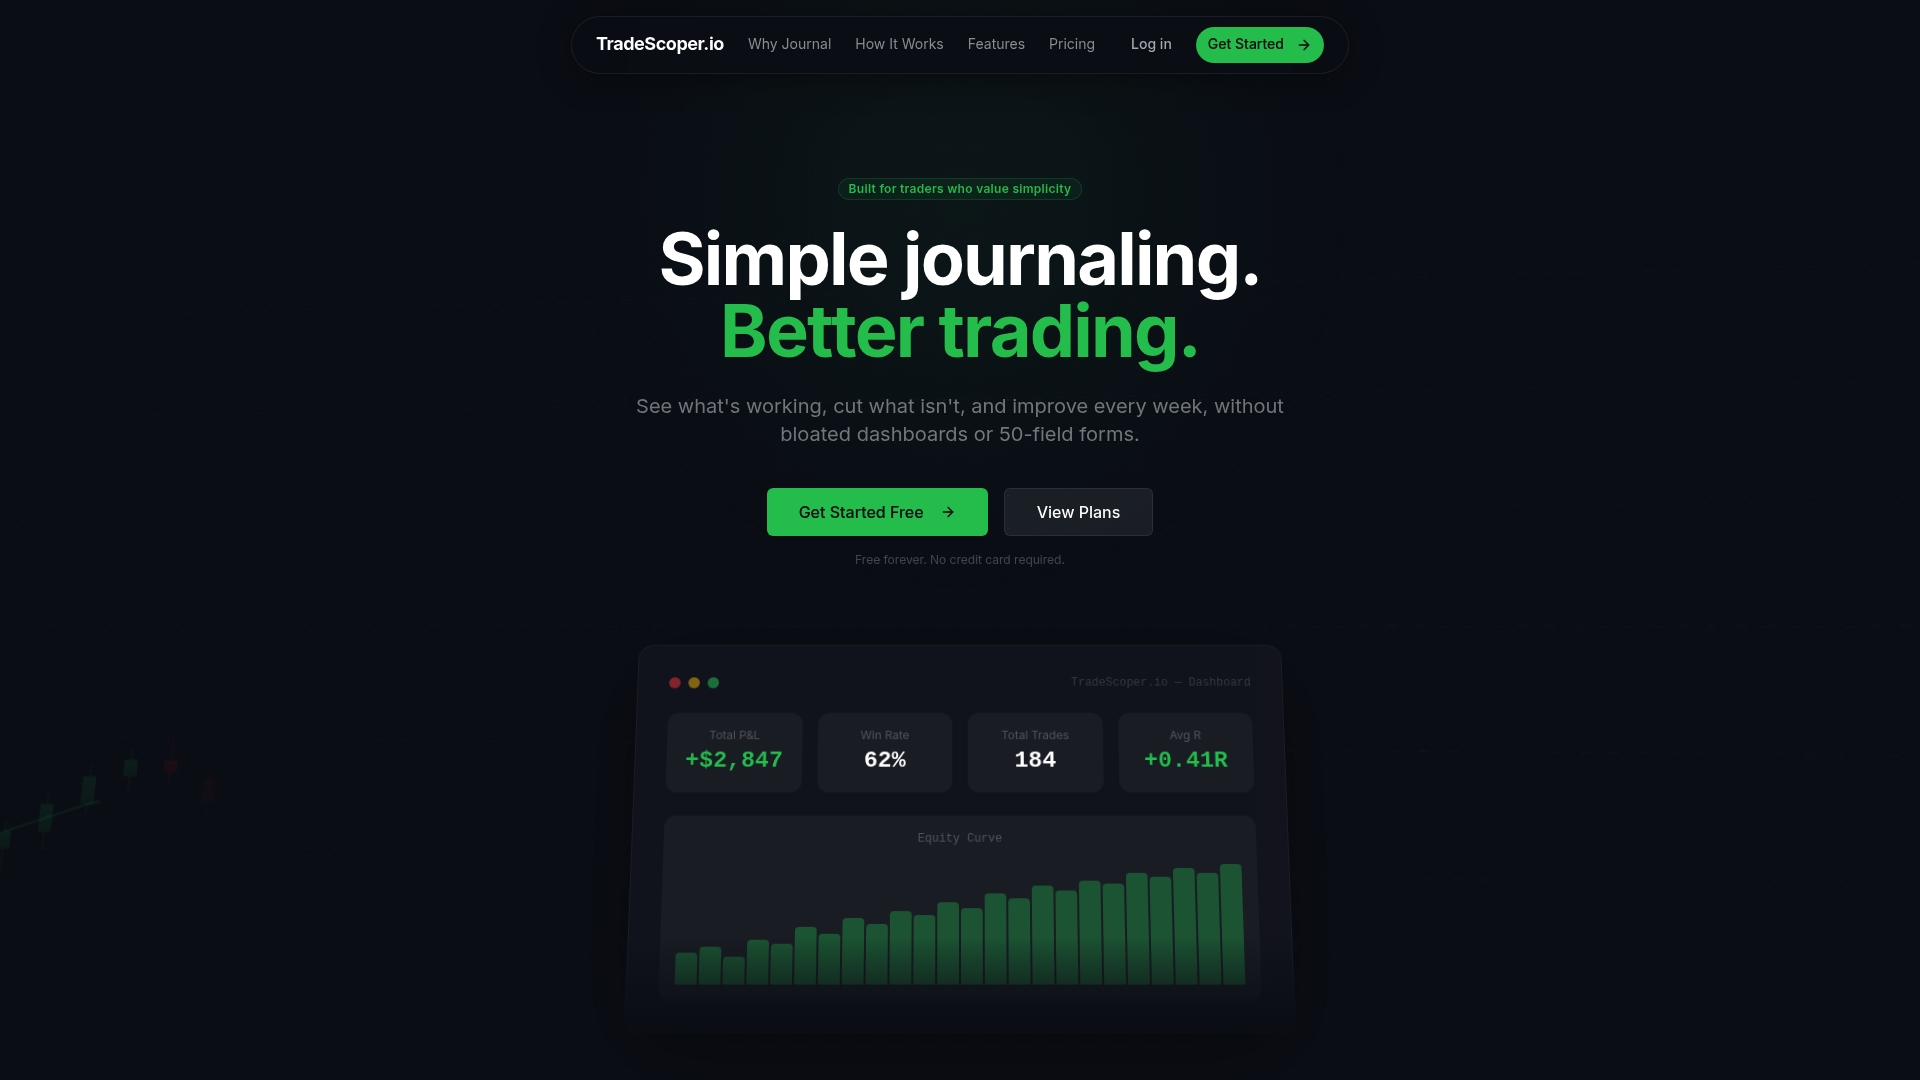
TradeScoper.io automates the heavy lifting. The AI trading journal captures your trades, tags setups, and surfaces patterns you would miss in a spreadsheet. The performance dashboard gives you a real-time view of every metric that matters, from rolling expectancy to session-level P&L. And the full suite of trading tools scales with you, whether you are logging your first 100 trades or managing multiple accounts across markets. Spend less time on manual tracking and more time executing with confidence.
Frequently asked questions
What is the single most important metric in trader development?
Expectancy is the key statistic, measuring your average outcome per trade. A positive expectancy confirms your process is working, not just your recent luck.
How often should I review my trading journal?
Day traders benefit most from daily or weekly reviews, while swing traders should prioritize deep weekly reviews by style to capture the full context of multi-day positions.
How many trades are needed to validate a backtest?
A meaningful backtest needs at least 100 trades to produce statistically reliable results. Fewer trades leave too much room for variance to distort the picture.
What is 'edge decay' and how do I detect it?
Edge decay means your strategy has stopped working in current market conditions. Detect it by tracking rolling expectancy across your most recent trades and watching for a sustained downward trend.
Are simple or complex strategies better for long-term success?
Data from 100,000-plus backtests consistently shows that simple, well-reviewed strategies outperform complex ones in live trading conditions.
Recommended
- Trade logging explained: boost consistency by 73%
- AI Trading Journal with Pattern Analytics for Sharper Edge
- Day trading tips: proven strategies for profitability in 2026
- AI Trading Journal with Pattern Analytics for Sharper Edge
- How to build trading skills: a step-by-step guide
- Top best practices for traders: boost performance in 2026